About Jira VSM
If you get here I believe you already know about Value Stream Mapping, Agile/Scrum, and Lean. I am a big fan of them and inspired to build this tool. This tool is designed to help you quickly identify and analyze the bottleneck in your value stream and that's all it means.
The idea is to analyze the value stream via information from Jira's tickets in a period of time. Those tickets can be from a Sprint, a project, a person they are assigned to, a filter, or a custom JQL you provided. The tool will grab those tickets from Jira and analyze how they are processed, provide charts and detailed data to give you insights of performance and efficiency.
Using this tool you can point out the wastes and find a way to reduce them, or even get rid of them to make your SDLC more productive.It will help you answer the questions below.
If you need supports or has some idea help us improve the tool please send us an email to jiravsm@gmail.com.
Who slows the team down?
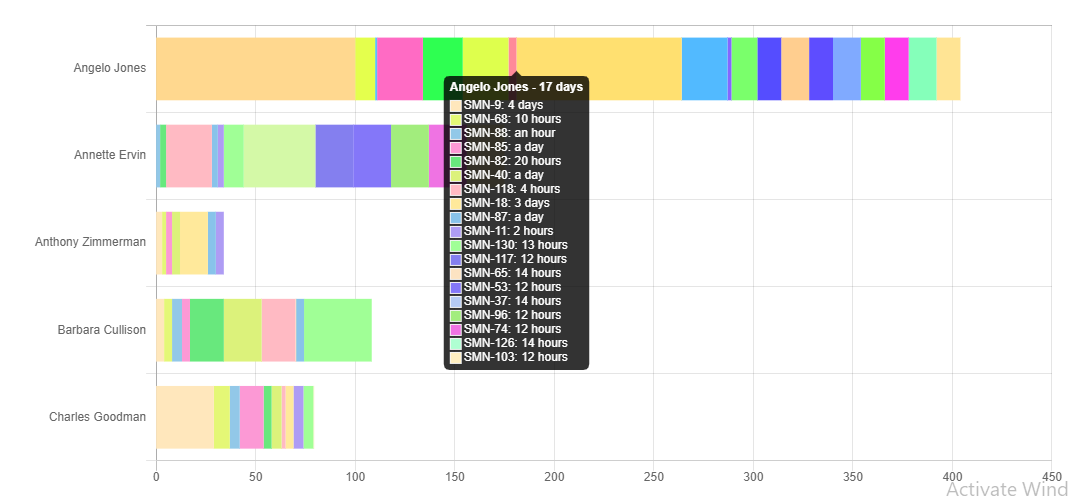
You can use the time in person chart to get that answer. It is not about the person's performance but about the efficiency of the process.The report just shows how long your tickets are stuck at a person (assigned time) and that is an indication of inefficiency.It might be there are a lot of tickets assigned to him or his performance is terrible or event he just didn't follow the rule (never update status as expected).Whatever the reason, you should find a way to solve that and optimize time to impact or lead time in your value stream.
- See the problem at first glance
- Point out exactly who is overloaded
- See exactly how bad it is with clear numbers
- Look into the tickets was assigned to John
- The best person slowing down his team ???
Where the hell it's stuck?
Software development is very much like a factory than you think. It is more complicated than the process in a factory but tickets also go to several states, status, before they ship to production and make their value.
It is not easy to get the answer for a large number of tickets by looking into them directly in Jira one by one. The "Time in status" chart will help you get that answer easily.
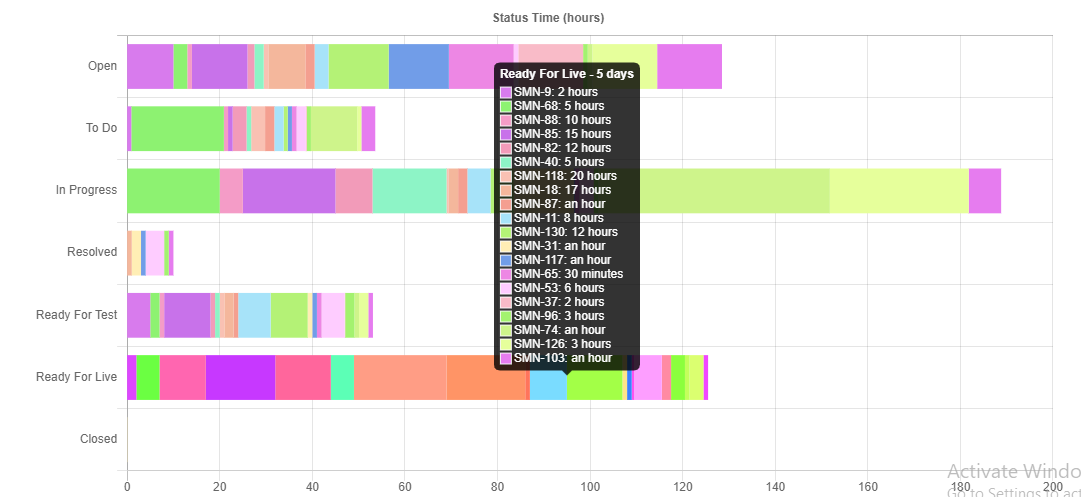
- See the bottle-neck at first glance
- Point out exactly where tickets are stuck
- Able to see status time in group
- Can See exactly how bad it is with clear numbers
- Tickets are stay in Test too much?
- Waiting time is too much compare to development time?
How the hell are our tickets going on?
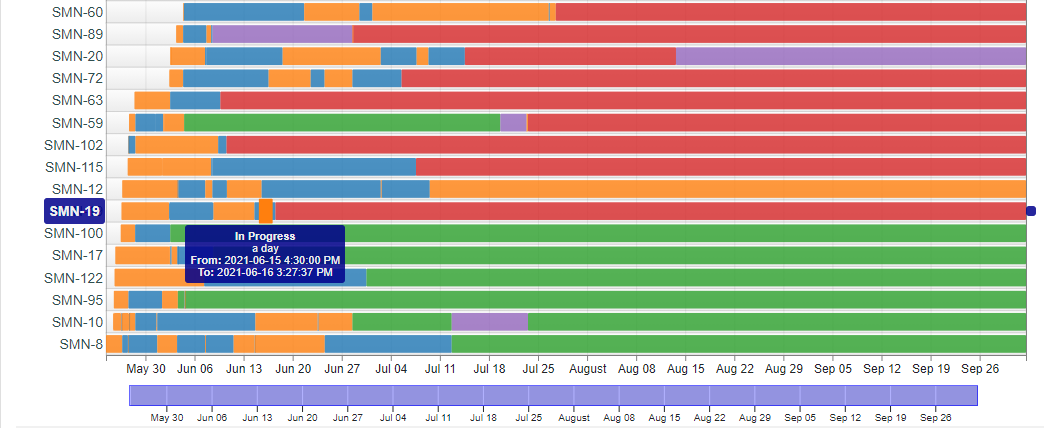
Well, after you see that tickets are stuck in a status or a person is overloaded. You might want to see how the tickets going in detail. It is very hard to do that by looking in ticket history in Jira. The "Time In Person" and "Time in Status" timeline charts will give you that information visually.
- With timeline you can see the problems with first glance
- See multiple problems at once in the same chart
- See exactly how bad it is with clear numbers
- Zoom supports to see in more detail
- Why that ticket stuck in John too long?
- Why that ticket switch back and forth between people?
- Why that ticket switch back to Inprogress several times?
We wasted our time on what?
Beside the time in person and time in status, you might want to see how much effort your team spent on the tickets. If your team submit their working time on each ticket, you can use the "Tickets Working Hour" chart to get that information.
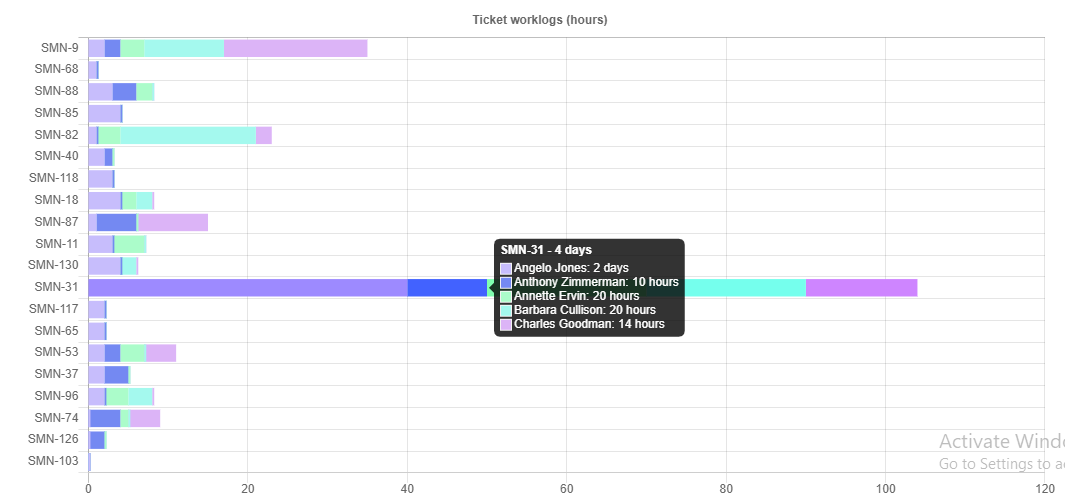
- See the tickets team spent much time on them at glance
- See people working time in one ticket
- Why we spent too much on SMN-31?
- Why John spent so much time on SMN-31?
- Why no one works on SMN-103?
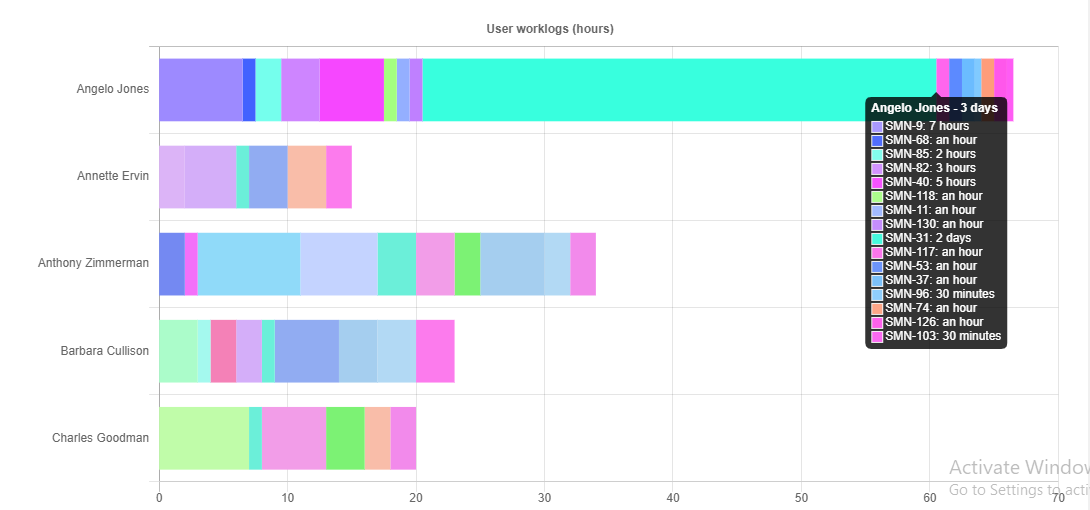
How hard people working?
You might also want to analyze how a person spent their time on tickets. If your team submit their working time on each ticket, you can use the "User Working Hour" chart to get that information.
- See the people spent log most work time at glance
- See how people spent their working time in tickets
- Why Annette work log is a little?
- Why John spent so much time on SMN-31?
How to use it?
We want this tool to be simple and easy to use, but provide you with a clear view of how things going inside your team. To use it you just provide some information and hit the Analyze button, and discover the insights.
However, there are some concepts that we need to mention to clear the confusion when people view the result.
Completed Status
We don't want to credit the action taken after the tickets are already completed (or closed). The time after they are completed/finished should not be accounted for when analyzed. You can provide the status that tickets are closed so the tool can ignore the time ticket in that status.
Analyze Time
The tool only analyzes tickets' activities that happened during the analysis period. You can set the Analyze Start Date and Analyze End Date to limit it. If it is not set, the tool will analyze tickets for the whole time.
Calendar
You can set the calendar setting to specify the business hours for your team.
Data privacy
The only information we store is the calendar setting in browser cache.We don't store any of your data in our server or sendthem to another party. The tool just get the information from jira, analyze it to find you insights.